InfraPulse

Delivered throughput, per GPU, per hour

InfraPulse is the accounting layer between the telemetry your GPUs already emit and the number your budget owner actually needs: how many of the GPU-hours you paid for did real work, and where the rest went.

Read-only. NVIDIA DCGM and AMD amd-smi. Kubernetes and Slurm aware. No scheduler changes, ever, without you asking.
One GPU-hour measured three ways: allocation 100%, busy about 100%, delivered a fraction of the hour
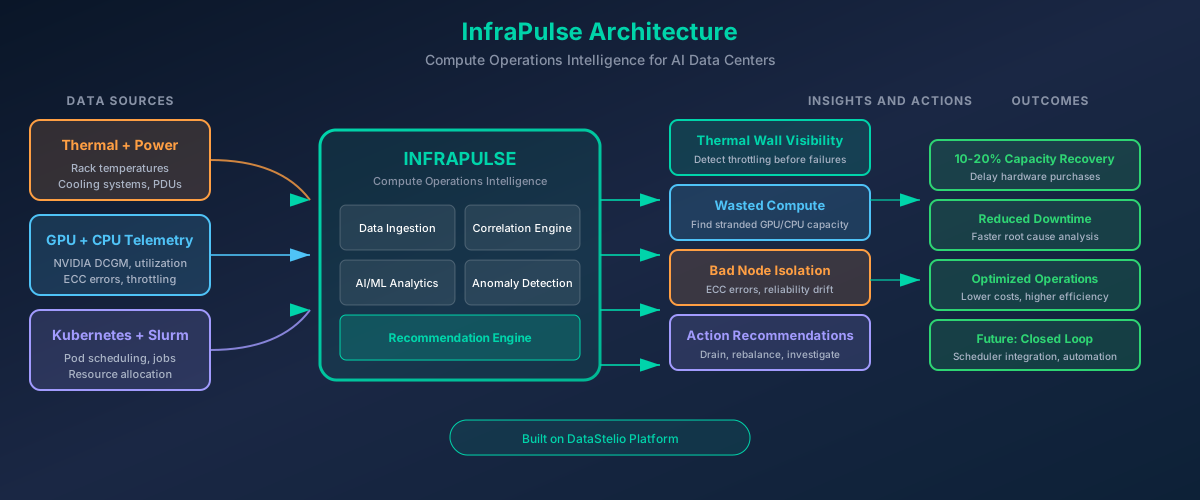
InfraPulse architecture: GPU telemetry, throttle and health signals, scheduler context, metrics exports and node/facility data flow into a read-only platform that collects, baselines, attributes and accounts for delivered GPU-hours, producing a thermal map, attributed findings, recommendations, drift alerts and a daily yield report
Telemetry you already have, in on the left. Findings you can act on, out on the right. Nothing in the middle writes to your scheduler or your clocks.

What it measures

Most monitoring stacks stop at the coarse device metric. InfraPulse reads the fine-grained fields underneath it and does the arithmetic that turns them into an account.

Signal Source fields What it tells you
Effective compute SM active, SM occupancy, tensor active, DRAM active (DCGM profiling fields); amd-smi activity counters on AMD How much math the device completed against its rating — the "delivered" number the busy metric hides.
Throttle attribution clock throttle reasons bitmask, SM/memory clocks, power draw, temperature Why clocks dropped (thermal, power cap, HW slowdown, sync boost) and how many effective hours each reason cost.
Reliability drift ECC counters, XID events, per-GPU baselines over time The node that has quietly become the slow one, before it shows up as a failed job or a "flaky" application.
Allocation vs. delivery Kubernetes pod / Slurm job context, read-only Which allocations produced throughput and which held a device warm — by tenant, by job class, by hour of day.
GPU-hour accounting Your cost basis (rental rate or amortized capex) per SKU Every shortfall priced in the unit your budget is written in. Nothing here is a vendor's estimate; it is your fleet's own numbers.

See these signals on an interactive thermal map

How it works

1

Collect, read-only

A single container or systemd unit per node reads DCGM or amd-smi and, if present, the local scheduler's read-only API. Or skip it: export 24 hours from Prometheus and send the file.

2

Baseline every GPU against itself

A device's normal is learned from its own history under real load, then compared against its SKU rating and its siblings in the same rack. Drift is detected as drift, not as noise.

3

Attribute and price

Each hour's shortfall is assigned to a cause with a signal timeline — before and after, not correlation — and priced in GPU-hours from your cost basis. The output is a finding you can act on and a number you can defend.

Where the AI agents come in

The telemetry is the ground truth; the agents are the labor. Four of them do the watching, attributing, and recommending that a fleet team never has hours for — and hand every conclusion to a person with the evidence attached.

Watcher

Continuous per-GPU baselining. Flags drift from a device's own normal — ECC slope, throughput separating from siblings, a rack warming faster than its neighbors — before a threshold alarm would fire.

Attribution

Lines up throttle bits, power, temperature, tensor activity, and scheduler context into a cause with a signal timeline. Distinguishes hot-because-working, hot-because-cooling, and cool-because-starved.

Advisor

Turns a confirmed cause into a specific, reversible next step — move, drain, rebalance, check — priced in GPU-hours and explained in plain language. Recommends only; automation is opt-in, later.

Reporter

Writes the daily account of delivered vs. paid-for GPU-hours and answers questions against the same data: "why did D2 lose 400 GPU-hours this week?" The Path B written analysis is this agent's output, run once on your export.

Agents propose; operators dispose. They run on the same numeric metric samples the collector emits, carry a confidence level and their evidence on every finding, and have no write path to your scheduler, your clocks, or your BMCs unless you turn one on. See them at work on the demo hall →

Security and data handling

A willing operator usually stalls on one question: what leaves my network? Here is the answer, and it is also available as a one-page PDF on request before anything is installed.

Read-only, numeric, yours

The collector has no write path to your GPUs or your scheduler. What it emits is numeric metric samples keyed by a hostname alias you control. It carries no job names, no code, no workload payloads, and no credentials. There is no inbound connection from DataStelio to your environment at any point. Path B involves no software from us at all — you export, you send, we return a document.

  • No scheduler hints, no clock or power changes, no node drains
  • Metric samples only; hostnames aliased on your side
  • No inbound access; no shared credentials
  • Your data is deleted on request; findings are never published without written consent
  • Two-page design-partner agreement, no fees, either side can end it

Reads from what you already run

Nothing is replaced. If you have DCGM or amd-smi and a scheduler, you have everything InfraPulse needs.

NVIDIA DCGM (dcgmi, dcgm-exporter) AMD amd-smi / ROCm SMI Prometheus / OpenMetrics exports Kubernetes (read-only API) Slurm (sacct / scontrol, read-only) Redfish / IPMI — roadmap Rack and cooling telemetry — roadmap

Where this is going

Measurement first. Recommendations only once the measurement has been confirmed real by the operators who own the fleet. Automation last, and only when asked.

Now · design partners

Measure and attribute

  • Path B written analysis from a 24-hour export
  • Read-only collector for NVIDIA and AMD fleets
  • Per-GPU self-baselining and throttle attribution
  • Findings priced in GPU-hours from your cost basis
Next

Continuous yield accounting

  • Watcher and Attribution agents running continuously, not once per export
  • Fleet-wide delivered-throughput scoring per node and SKU
  • Reliability drift and bad-node isolation with history
  • Allocation-vs-delivery by tenant and job class
  • Rack and cooling correlation
Later

Recommend, then automate on request

  • Advisor agent: what to move, drain, rebalance, or investigate — explained, with GPU-hours at stake
  • Placement guidance that is throughput-aware, not just allocation-aware
  • Scheduler hints and policy automation, opt-in only

Questions operators ask

Doesn't Datadog, Grafana, Run:ai, or Anyscale already do this?

They are good at what they do, and we use their exports as inputs. Monitoring tools have converged on alerting and health — they will tell you a GPU is throttling. Orchestration tools enforce quotas and pack bins from what jobs request. Neither closes the loop from a throttle event to what it cost you in deliverable GPU-hours against your own cost basis. If you find one that does, tell us; it would change our picture of the problem.

We are sold out. Why would we care about a few points of throughput?

That is the right objection and it changed how we frame this. In a sold-out market nobody feels slack, so "how much are you wasting?" is the wrong question. "How many sellable GPU-hours can this fleet deliver from iron already racked?" is a question about the constraint itself. New racks arrive in quarters; a yield point lands this month. If your honest answer is still "we care about power and delivery dates, not throughput," we would rather hear that now.

We run AMD Instinct. Does any of this apply?

Yes, and AMD fleets are the case we are most interested in — there is almost no reference tooling built on amd-smi and ROCm SMI, so the delivered-throughput picture on MI300X-class hardware is nearly unstudied. Path B works the same way: send amd-smi metric output for 24 hours.

What exactly do we send for Path B?

Any of: a dcgmi dmon capture with the profiling and throttle-reason fields enabled, a Prometheus range export of your dcgm-exporter metrics, or amd-smi metric output on a loop. Twenty-four continuous hours from a handful of nodes is enough to start. We reply to your first message with the exact two-line command for your exporter.

What does it cost?

Nothing during the design-partner phase. In exchange we ask for candor: is any of this news to you, and what would you pay for it if it were? Pricing after that will be tied to fleet size, in GPU-hours, because that is the unit the value is measured in.

Send 24 hours of metrics. Get a written analysis back.

No agent, no access, no NDA. Tell us the fleet and the exporter and we will reply with the export command.